
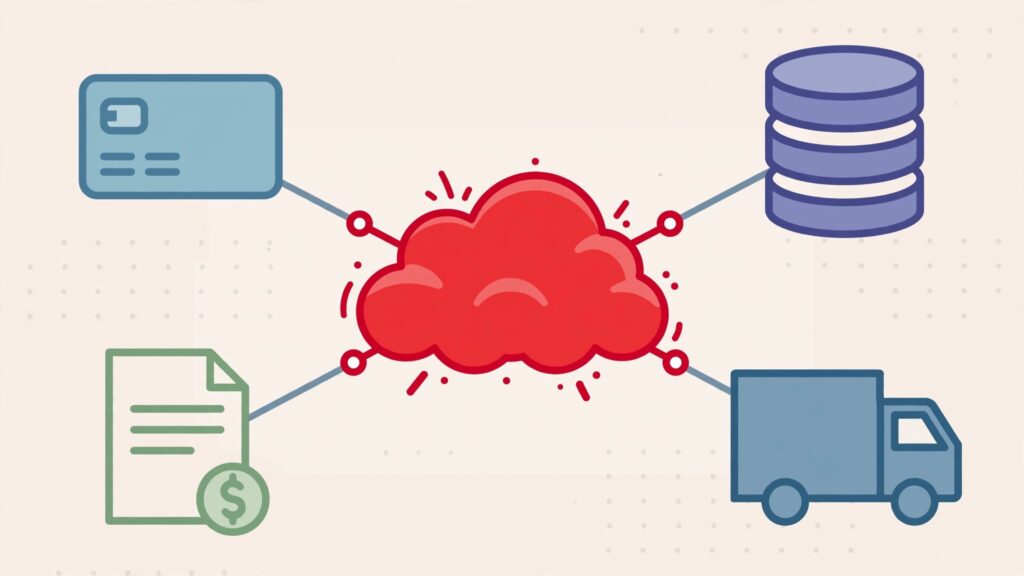
Measure vendor concentration risk through spend share, critical-function coverage, and shared dependencies that could disrupt services beyond recovery limits. Then test whether one failure could interrupt several business services beyond your recovery limits.
Your vendor list can look diversified while payroll, payments, customer delivery, and backups share infrastructure. That hidden concentration won’t appear in your contracts.
Start with business impact to assess operational resilience, then work backward through the systems and suppliers that support it.
Key Takeaways
- Measure spending, critical-function coverage, geographic clustering, and single-source dependencies together.
- Treat concentration thresholds as review triggers, not proof that exposure is acceptable.
- Test whether backup suppliers share infrastructure, identity, hosting, or subcontractors.
- Give leadership a clear view of consequences, recovery evidence, accountable owners, and decisions required.
What Technology Vendor Concentration Means
Technology vendor concentration is the extent to which your business depends on one provider or a shared underlying dependency. Third-party risk asks whether a supplier could fail. Concentration asks how much of your business would fail with it.

The July 19, 2024 CrowdStrike update crashed an estimated 8.5 million Windows computers. Delta reported about $380 million in lost revenue and $170 million in added expenses. Roughly 60% of its mission-critical applications depended on Microsoft’s Windows operating system.
The consequence was operational. Flights, customers, staffing, and recovery were affected together.
A supplier can have strong security controls and still represent an unacceptable concentration of business dependency.
Map Critical Business Systems Before Counting Vendors
Start with the business services you must preserve
Identify the critical functions that protect revenue, cash flow, customer delivery, and regulatory obligations. Set an outage tolerance for each critical function before disruption becomes unacceptable.
Build a systems inventory for each function. Record its applications, business and technical owners, vendors, data, access privileges, integrations, cloud, identity, and infrastructure dependencies, plus recovery requirements.
Include operational technology where relevant. Unsupported firmware, patch gaps, and recovery documentation belong in the inventory when those assets support critical operations.
Reconcile purchasing records with actual usage
Finance’s supplier list is a starting point. Reconcile it with contracts, software subscriptions, cloud accounts, and departmental purchases to expose shadow IT and measure supplier concentration.
Group subsidiaries under their parent provider. Otherwise, an acquisition can leave several supplier names masking one dependency.
Rank vendors as critical vendors, important vendors, or readily replaceable. A risk-based vendor inventory gives your team a manageable starting point without buying another platform.
Measure Technology Vendor Concentration Across Four Dimensions
Keep each metric tied to a clear denominator
Use these measures together.
| Measure | Calculation or assessment |
|---|---|
| Spend concentration | Provider spend divided by total third-party spend or a defined critical category |
| Critical-function coverage | Critical functions dependent on a provider divided by all critical functions |
| Geographic clustering | Share of critical functions dependent on one region, jurisdiction, or infrastructure location |
| Single-source dependency | Critical functions without a tested substitute or workable recovery path |
Keep category spending separate from total spending. A supplier can represent a small share of your overall budget while controlling all payment processing.
Count each critical function once per provider. Function shares across providers can exceed 100% because one function can depend on several suppliers. Weight coverage by business criticality and impact tolerance across critical functions.
Work the calculations, then inspect the dependency
For example, $400,000 in provider spending against $1 million in total spending gives a 40% spend share.
Four dependent functions out of ten produce 40% coverage. If six functions depend on the same underlying cloud provider, including through indirect dependencies, cloud exposure is 60%.
These measures show different exposures. Spend share shows commercial concentration, while function coverage and mapped indirect dependencies show operational exposure. Use the results to support assessment, not replace judgment about business impact, substitutability, and recovery options.
Record unknown dependencies separately. Missing information isn’t evidence of diversification.
Use Thresholds as Alerts, Not Standards
Common working conventions flag a provider above 25% of total third-party spending or a critical spend category. These measures help identify supplier concentration. Critical-function coverage above roughly 30% to 40% commonly triggers review.
Treat any concentration threshold as a review trigger, not an acceptance standard. Set thresholds based on the consequence of failure, recovery capability, and acceptable disruption.
Some frameworks use CR-1 above 30%, CR-3 above 60%, and CR-5 above 80%. These measures show the combined shares of your largest one, three, or five suppliers within a defined category.
The Herfindahl-Hirschman Index, or HHI, sums squared percentage shares. A 40%, 30%, 20%, and 10% split produces 3,000.
The familiar 1,500 and 2,500 bands come from the 2010 US Horizontal Merger Guidelines, not DORA. They describe historical competition-policy categories, not operational recovery limits. DORA sets no numerical concentration threshold.
Find Hidden Fourth-Party Dependencies
Ask critical suppliers what sits underneath their service
Request disclosures covering hosting, a cloud provider, regions, DNS, identity, managed service providers, and subcontractors. Follow material dependencies beyond that tier when another provider supports a critical service.
Direct vendor concentration counts suppliers your organisation contracts with. Fourth-party dependencies are underlying providers that can connect otherwise separate suppliers and create hidden concentration.
Supplier disclosures are usually the main route to this visibility. Security certifications alone won’t reveal your combined exposure.
Risk Ledger’s 2026 concentration-risk analysis reports that only 30% of 500 UK cyber and TPRM professionals had full subcontractor visibility.
Across 30 financial institutions, it identified 1,322 potential concentration risks, including 288 rated critical. Across 26 government organisations, it found 1,264, including 224 critical.
Test whether the shared dependency can stop recovery
A shared provider becomes a single point of failure when its loss interrupts critical functions and your alternatives can’t restore service within tolerance.
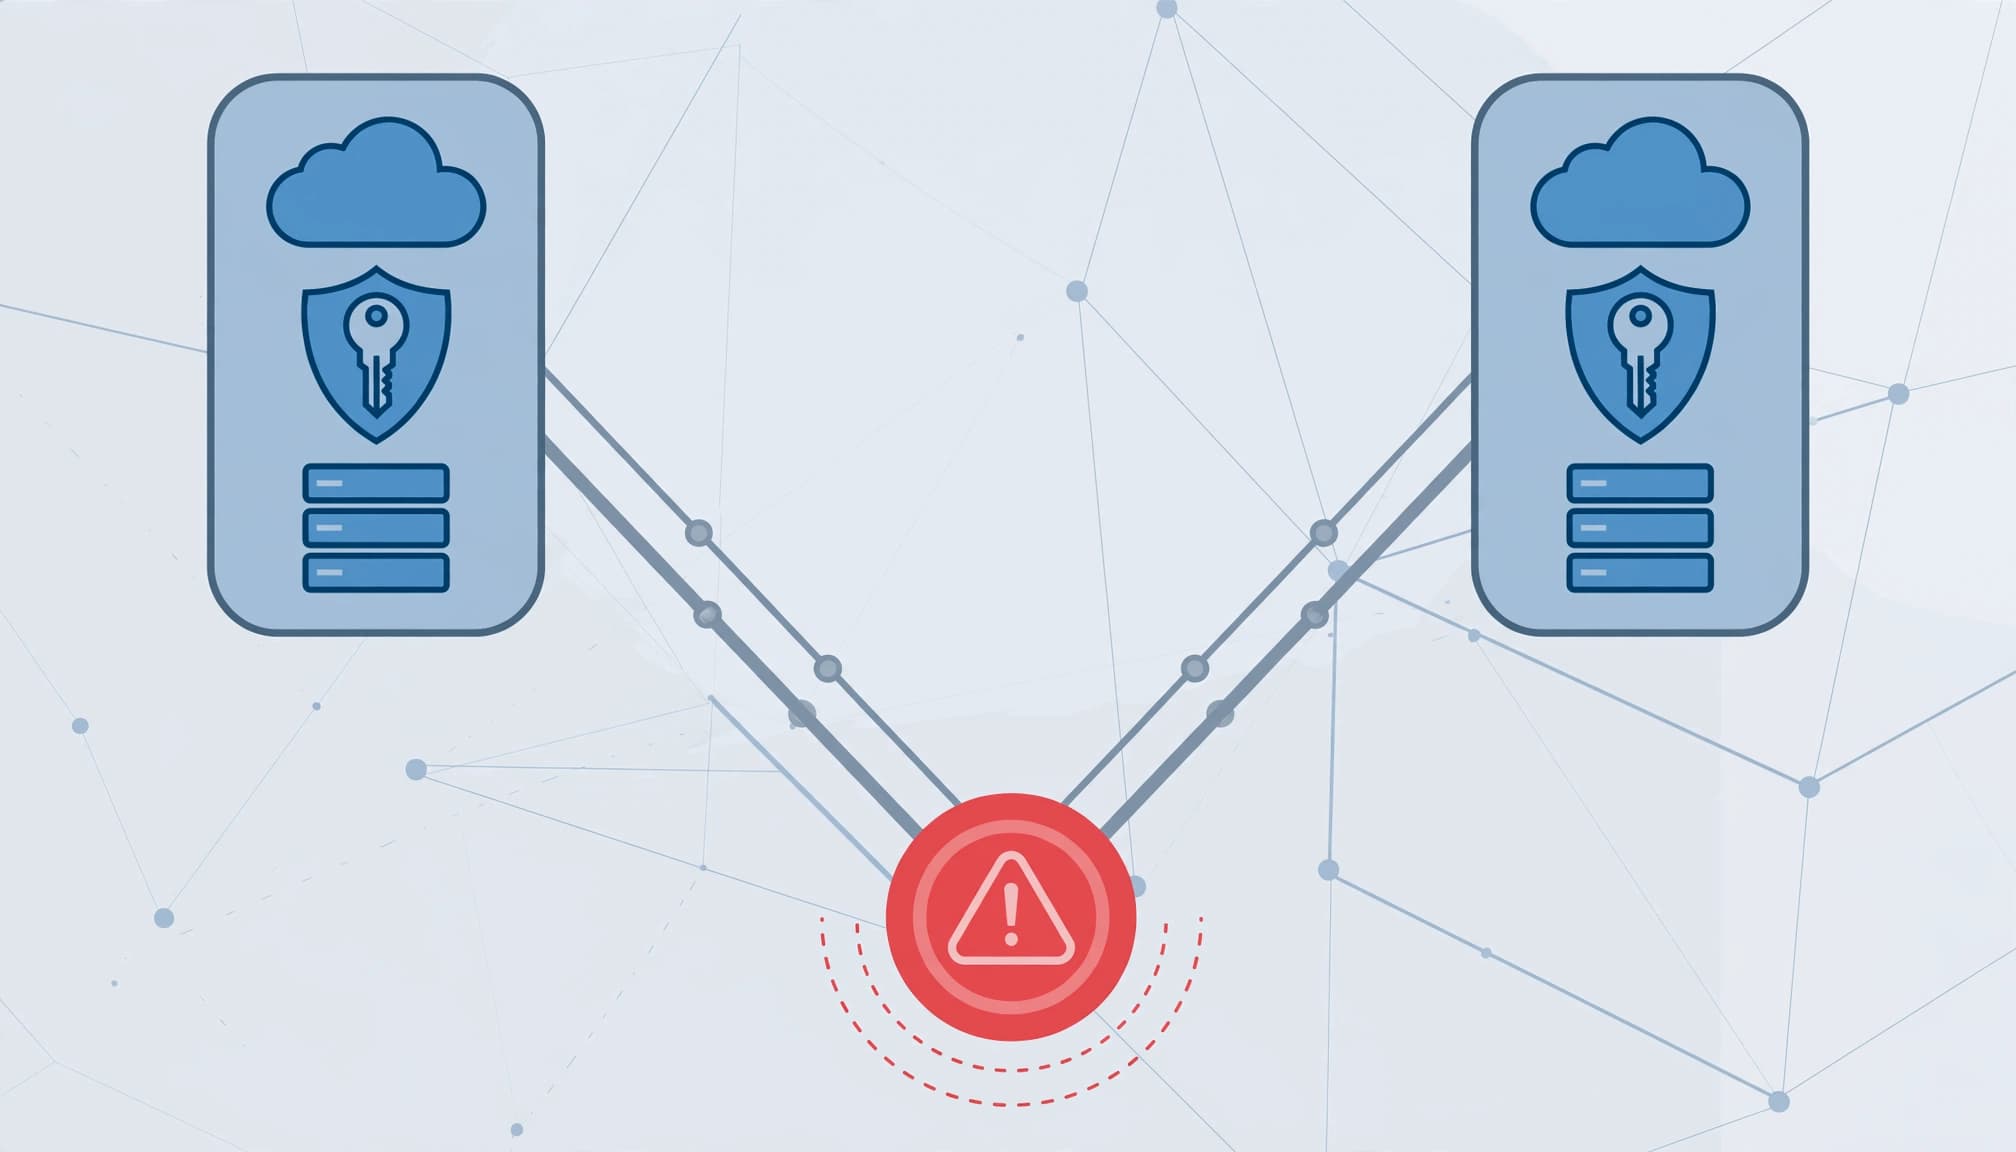
Examine the failure domain. Two cloud regions may protect against a regional outage while sharing identity, administration, or a control plane.
Risk Ledger describes two suppliers of a critical reagent that rely on the same fourth-party provider. The backup arrangement moved the dependency one tier down.
A backup supplier reduces concentration only when it can operate through the failure you are planning for.
Look Beyond Your Own Supplier Portfolio
Market concentration can limit your alternatives even when purchasing is well managed.
Risk Ledger cites a Cambridge Centre for Alternative Finance survey in which the top three cloud providers served more than 80% of financial services. It also cites roughly 80% CDN market concentration around Cloudflare, though that estimate depends on the market definition.
Cloudflare’s June 2022 outage affected 19 data centres, with reported disruption touching Google, Amazon, Facebook, and other services.
Hardware creates similar exposure. Estimates put TSMC’s production at around 90% of the most advanced chips. Goldman Sachs identified about 169 industries affected by the global chip shortage, a figure discussed in UK Parliament’s semiconductor briefing.
Understand What Regulators Expect
For EU financial entities, DORA Articles 28 and 29 require concentration assessment before new ICT arrangements. Article 29 addresses substitutability and accumulated arrangements involving the same provider or closely connected providers.
The practical question is whether another contract increases a dependency you already struggle to replace.
The FCA’s outsourcing and operational resilience guidance makes accountability clear. Your firm remains responsible for staying within impact tolerances when third parties support important business services.
A fourth party shared across several services therefore belongs in scenario testing.
UK PRA SS2/21 also addresses outsourcing and third-party risk management. Singapore’s MAS Technology Risk Management Guidelines and India’s RBI IT outsourcing directions establish jurisdiction-specific expectations. Apply the rules relevant to your entity rather than treating one threshold as universal.
Reduce Exposure Without Creating More Complexity
Make recovery independent and demonstrable
Diversify suppliers where one failure could stop multiple critical functions, and verify recovery to improve operational resilience. Test data exports, alternate access, manual processing, and end-to-end recovery.
Align business continuity planning and disaster recovery planning with actual supplier capabilities. Your vendor incident response plan should name escalation contacts, decision authority, customer communications, and recovery ownership.
Contract terms should address incident notification, subcontractor changes, evidence rights, data portability, and exit support. Test vendor offboarding before you need it under pressure.
Keep the economics visible
Consolidation can improve pricing, integration, support, and accountability. Diversification can increase cost, technical debt, and operational complexity.
Compare those benefits against disruption costs and recovery limitations. Technology spend optimization should preserve recoverability, not chase supplier discounts alone.
Put material improvements into your technology roadmap with an owner, budget, milestone, and recovery test. Where a technology leadership gap leaves decisions unowned, a fractional CTO or interim CTO can establish executive accountability.
Give the Board Decisions It Can Govern
Your board-ready risk summary should show the shared dependency, affected business functions, current exposure, recovery evidence, accountable executive, and decision required.
Keep spending and operational dependency distinct. A low-cost identity provider can carry more business risk than your largest software contract.
Useful third-party risk reporting to the board explains whether leadership must fund an alternative, accept exposure, renegotiate terms, or change the architecture.
Maintain continuous monitoring rather than relying on an annual snapshot. Trigger reassessment when a provider is acquired, introduces a sub-processor, changes region, suffers an incident, or takes on another critical function.
Record accepted exposure and the authority approving it. Technology governance needs a visible decision trail, not a reassuring dashboard.
Frequently Asked Questions
Is vendor concentration the same as single-source risk?
Single-source risk concerns dependence on one supplier for a particular requirement. Concentration also includes several suppliers sharing infrastructure, ownership, geography, or subcontractors.
How many vendors should support a critical function?
There’s no universal number. Two suppliers may leave single-source risk effectively unchanged if they share a failure point. Measure whether your operating alternatives can maintain service within the required tolerance.
Can a smaller company start without a TPRM team?
Yes. Start with finance’s supplier list and your critical business functions. Use a spreadsheet, assign one executive owner, request dependency disclosures, and test the highest-impact outage first.
Make the Next Decision With Clearer Visibility
Technology vendor concentration becomes manageable when you can see which failures would stop the business and whether recovery would work.
Begin with your critical functions. Give each shared dependency an owner and a tested recovery path.
If that picture is scattered, Get an Executive Technology Clarity Check. We help you identify the exposure that matters most and establish a practical next step.