

You connect product reliability to customer retention by linking failures, recovery times, and repeat incidents to renewals and repeat purchases. Then you fund improvements based on the customer relationships and margin they protect.
Your engineering team may see defects while your commercial team sees churn. You need one operating picture that connects reliability signals, commercial outcomes, and the customer experience.
Start with the customer promise, then measure where your product breaks it.
Key Takeaways
- Pair reliability measures with customer retention and revenue outcomes for the same customer groups.
- Separate product failures, misleading expectations, and poor recovery. Each needs a different response.
- Give every material reliability problem an accountable owner, a business consequence, and a decision date.
Treat Reliability as a Revenue Decision
Understand what you are protecting
Customer retention measures your ability to keep existing customers over time. Customer acquisition brings new customers in. Retention determines how much of that growth remains.
IBM, citing McKinsey, says you need three new customers to replace the customer lifetime value lost when one existing customer leaves. Productboard, citing Forbes, puts customer acquisition cost at five to seven times the cost of retention.
Those comparisons explain why reliability deserves executive attention. Use customer retention economics to set the reliability investment, and make reliability part of a broader retention strategy.
Count more than the repair bill
Warranty costs show part of the exposure. According to Warranty Week’s annual report, U.S. manufacturers paid $30.37 billion in warranty claims in 2025. The average claims rate was 1.30% of product sales revenue.
Your business also absorbs support effort, credits, returns, and interrupted customer work. Lost renewals and weaker repeat purchasing sit outside the repair budget.
Ask finance to review claims against the warranty policy and separate these costs. Track potential effects on brand reputation separately, since engineering savings can hide commercial losses.
Measure Product Reliability Before Customers Leave
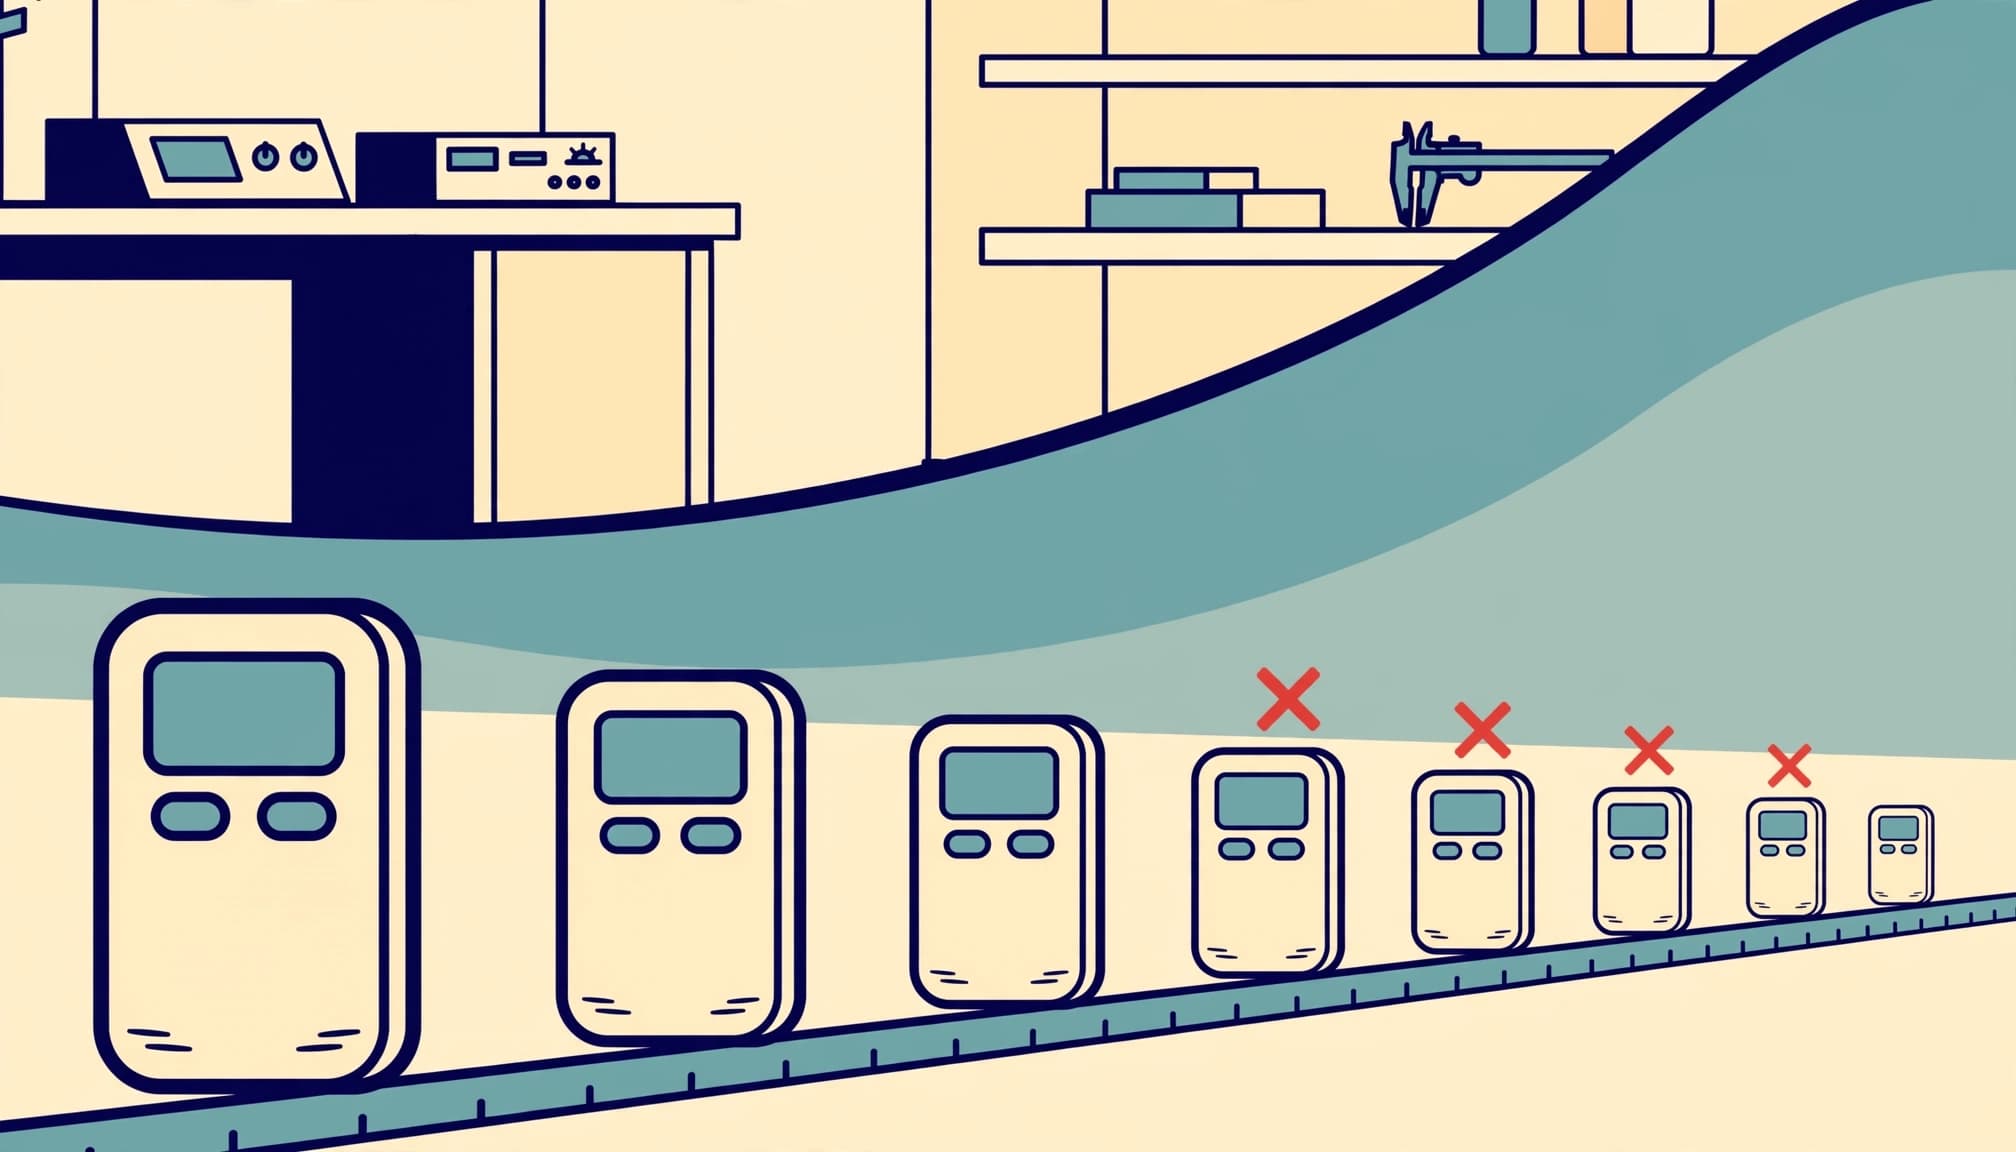
Track failure frequency and customer impact
For repairable products, mean time between failures (MTBF) = total operational time / number of failures.
Under a constant-failure-rate model, failure rate = 1 / MTBF. The reliability function is:
R(t) = exp(-failure rate x t)
It estimates the probability of operating without failure over time t. Use consistent time units. NIST’s reliability model supports this approach when the constant-rate assumption fits.
Wear-out and early-life defects need different treatment. For software, also track failed customer workflows, change failure rate, and customer impact duration. High availability can coexist with broken ordering or billing.
Prioritize consequences, not just counts
Failure Mode and Effects Analysis (FMEA) helps teams identify how a product can fail and what follows.
The traditional risk priority number is RPN = Severity x Occurrence x Detection, with each factor rated 1 to 10. A higher detection score means the failure is harder to detect before harm.
The 2019 AIAG-VDA handbook replaced RPN-based prioritization with Action Priority for automotive FMEAs.
You don’t need every technical score in the board pack. You need visibility into failures that threaten safety, customer commitments, revenue, or continued operation.
Put Customer Retention Metrics Beside Failure Data
Define retention and churn consistently
Use one measurement period and one definition of an active customer.
Customer retention rate = ((E – N) / S) x 100, where E is customers at period-end, N is new customers acquired, and S is customers at the start.
Customer churn rate = (customers lost during the period / customers at the start) x 100.
Define how you handle reactivations and new customers who leave within the same period. Otherwise, departments can report different answers from the same records.
For retail, repeat purchases within a six-month window may be useful. For subscriptions, renewal cohorts are usually more meaningful. Match the window to how customers buy.
Separate customer counts from customer value
Net dollar retention measures recurring revenue retained from existing customers. It includes expansion and accounts for downgrades, cancellations, and pauses where they reduce recognized recurring revenue.
Review it beside customer retention. Expansion from a few large accounts can mask losses elsewhere.
Zendesk’s retention guide lists customer lifetime value as average order amount x purchases per year x retention rate.
That expression lacks an explicit lifetime horizon and margin. Treat it as a limited retained-revenue proxy, not a complete lifetime valuation.
For investment decisions, have finance estimate the contribution margin protected after support, refunds, discounts, and remediation costs. Revenue alone can overstate the return.
Connect Reliability Records to Customer Behavior
Join the records around the customer
Your product data and commercial data need a shared customer or account identifier. If commercial records are stored in a CRM system, its account identifier can help connect them to product incidents.
Connect incident dates, affected products, severity, exposure duration, and resolution to purchases, renewal dates, complaints, and cancellations. Include product version or manufacturing batch where relevant.
Data quality matters here. Missing account identifiers can make your worst failures disappear from the retention analysis.
Use software adoption metrics to add context about completed workflows and sustained use. Login counts alone won’t explain whether customers received value.
Compare similar customers over time
Compare customers exposed to failures with similar customers who weren’t. Account for tenure, contract size, product mix, usage, seasonality, and service level.
Then compare renewal rates, repeat purchase timing, support costs, and cancellation reasons. Customer exit data, customer feedback, and input from customer success teams offer useful customer insights into why customers leave.
A higher churn rate among customers reporting failures is a warning. It isn’t proof that every departure was caused by reliability.
After a fix, follow the affected group again. Look for fewer repeat failures and better customer outcomes. This closes the gap between technical improvement and business evidence.
Repair the Experience as Well as the Product
Correct expectations before improving promotion
A working product can still disappoint if your descriptions, compatibility claims, or delivery promises are wrong.
inriver’s product information research reports that 45% of shoppers won’t buy again when reviews are absent or product information is misleading. It also attributes 22% of returns to products failing to meet expectations.
Classify product returns accordingly. A defect needs engineering attention. Incorrect product information needs stronger governance and clear ownership.
Make recovery visible to the customer
Zendesk CX Trends reports that 85% of CX leaders say customers will leave after a single unresolved issue. That’s a leadership perception, not an observed churn probability for every business.
Give affected customers a named owner, a clear recovery commitment, and usable updates. Strong customer service after a failure shapes the customer experience. Track customer satisfaction, but don’t treat one measure as proof of retention. Suppress promotional messages while serious complaints remain unresolved.
Chipotle and Starbucks use a loyalty program that rewards repeat purchases with points redeemable for free items, supporting customer loyalty. Rewards can’t repair a product promise you keep breaking.
Build a Scorecard Leaders Can Act On

Keep the view small and decision-focused
Your technology dashboards should connect early warnings to business outcomes.
Use a compact view like this:
| Reliability signal | Customer outcome | Leadership decision |
|---|---|---|
| Failed critical workflows | Abandoned orders or delayed renewals | Prioritize repair against feature work |
| Longer recovery time | Credits, complaints, or cancellations | Fund recovery capability |
| Repeat incidents | Lower repeat purchasing | Require root-cause correction |
| Expectation-related returns | Lost margin and repeat business | Correct product information |
Give each measure a baseline, threshold, owner, and review period. Revisit the measures quarterly.
For board-ready reporting, show material exposure, the corrective action, residual risk, and the decision required. Directors don’t need the incident log.
Establish ownership and a 90-day plan
In the first 30 days, choose one critical customer journey. Agree on definitions and establish the baseline.
During days 31 through 60, connect the records and address the most damaging recurring problem. Include vendor management where an external dependency owns part of the failure.
By day 90, review leading indicators and available customer outcomes. Renewals may take longer to reflect the change.
Include these customer retention strategies in your technology operating plan, with clear ownership, funding, and decision rights. Test recovery commitments through business continuity exercises.
If you have a technology leadership gap, a fractional CTO or interim CTO can establish this operating rhythm. Keep commercial outcome ownership with your management team.
Frequently Asked Questions
Is 90% customer retention good?
It depends on the period and business model. Zendesk describes 85% to 90% or higher as generally strong. Its ranges include 50% to 70% for retail and ecommerce, and 75% to 90% for subscription businesses.
Compare equivalent periods, segments, and definitions before drawing conclusions.
Can MTBF predict customer churn?
MTBF estimates failure frequency under defined conditions. It doesn’t measure a customer’s willingness to stay.
Use it alongside actual incident exposure, recovery experience, renewal behavior, and cancellation reasons. You need observed customer relationships before treating reliability data as a churn predictor.
Which measures should you review first?
Start with failed critical workflows, customer impact duration, repeat incidents, and retention among affected customers. Add support costs and contribution margin.
Keep measures that change a decision. Remove those that only add reporting effort.
Make Reliability an Accountable Business Priority
You gain clearer control when product reliability and customer retention share evidence, ownership, and review dates. The strongest next step is small: one customer journey, one recurring failure, and one measurable business outcome.
If ownership and priorities remain scattered, Get an Executive Technology Clarity Check. We’ll help you identify what needs executive attention first.
Dependable products earn trust. Clear ownership makes that dependability repeatable.