
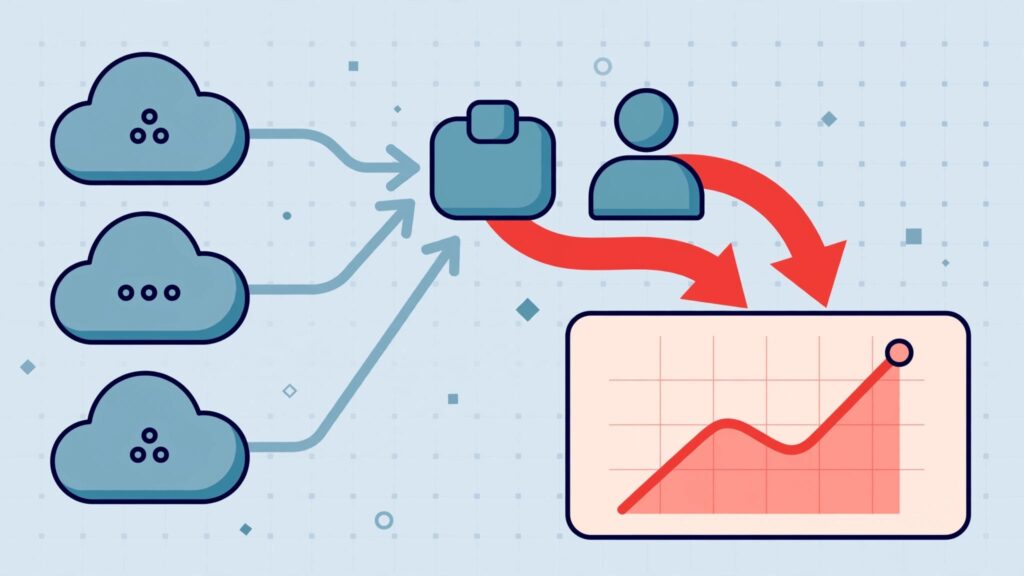
You connect infrastructure costs to the products, customers, and revenue they support to build a reliable view of gross margin. Then you measure whether serving each customer, product, or transaction is becoming more profitable.
Your cloud invoice alone won’t answer that question, and not every cloud dollar belongs in delivery costs. You need clear ownership, consistent accounting, and a view of what drives consumption.
Start with the costs behind your margin, then connect infrastructure decisions to the business results you expect.
Key Takeaways for SaaS CEOs
- Track SaaS gross margin with consistent cost categories, and calculate subscription and professional services margins separately so blended results don’t hide expensive delivery work.
- Connect production infrastructure costs to customers, products, and usage. Classify costs for service delivery in COGS where appropriate, and record development infrastructure in R&D or other operating expenses.
- Count realized savings after implementation costs and service impacts. Reclassifying an expense doesn’t improve the company’s underlying economics.
SaaS Gross Margin Starts With Consistent COGS
Gross margin measures what remains after the direct costs of delivering your product. That money must still cover product development, sales, administration, and profit.
Consistent classifications make gross margin trends easier to trust.
Include the costs of serving customers
SaaS cost of goods sold, or COGS, typically includes hosting and infrastructure used to deliver the product, customer support, production DevOps, third-party software licenses, and customer onboarding.
Start with a practical question: Could customers still access and use the application if you stopped paying this expense?
That test helps identify delivery dependencies. It isn’t a complete accounting policy. Onboarding labor, for example, can be a delivery cost even though existing customers would retain access without it.
Classify infrastructure by the activity it supports. Production infrastructure used to serve customers may be COGS, while development and test environments may belong in R&D or other operating expenses. These costs don’t automatically affect margin, so apply a consistent, documented policy.
Separate production infrastructure from development environments. They may share a provider invoice, but they support different activities.
Make the judgment calls explicit
Sales commissions, advertising, general and administrative overhead, and product development are generally outside COGS.
Customer success needs closer attention. Retention and service delivery work generally belongs in COGS. Work that sells renewals, additional seats, or upgrades may belong in sales operating expense.
Apply the same discipline to mixed engineering roles. Allocate production operations to COGS separately from new-product development, using a reasonable, documented method.
Keep that policy stable. Stronger margins should reflect better economics, rather than a more convenient expense label.
Calculate Subscription and Services Margins Separately
The formula is straightforward:
Gross margin = (Revenue minus COGS) divided by Revenue, multiplied by 100.
Use recognized revenue and its associated delivery costs for the same period. The amount left after delivery costs is the dollar profit; the gross profit margin expresses that amount as a percentage of revenue.
These published examples show why revenue scope matters.
| Published example | Revenue | COGS | Gross profit | Gross margin |
|---|---|---|---|---|
| Chargebee monthly example | $500,000 | $150,000 | $350,000 | 70% |
| Stripe total-revenue example | $1,100,000 | $450,000 | $650,000 | 59.1% |
| Chargebee custom-development example | $80,000 | $50,000 | $30,000 | 37.5% |
The Chargebee gross margin guide shows how custom development can produce a much lower margin than subscription delivery.
These are independent examples, not parts of one company’s P&L. Stripe’s SaaS gross margin explanation provides the total-revenue calculation.
For your own SaaS P&L, report subscription revenue, professional services, and other material streams separately. Match each stream with its delivery costs, then show its gross profit and margin before the blended total. The SaaS P&L should make each revenue stream and its associated costs clear.
Otherwise, a change in revenue mix can look like an infrastructure problem. More low-margin implementation work can reduce the blended margin even when subscription revenue becomes more efficient to deliver.
Allocate Infrastructure to What Customers Consume
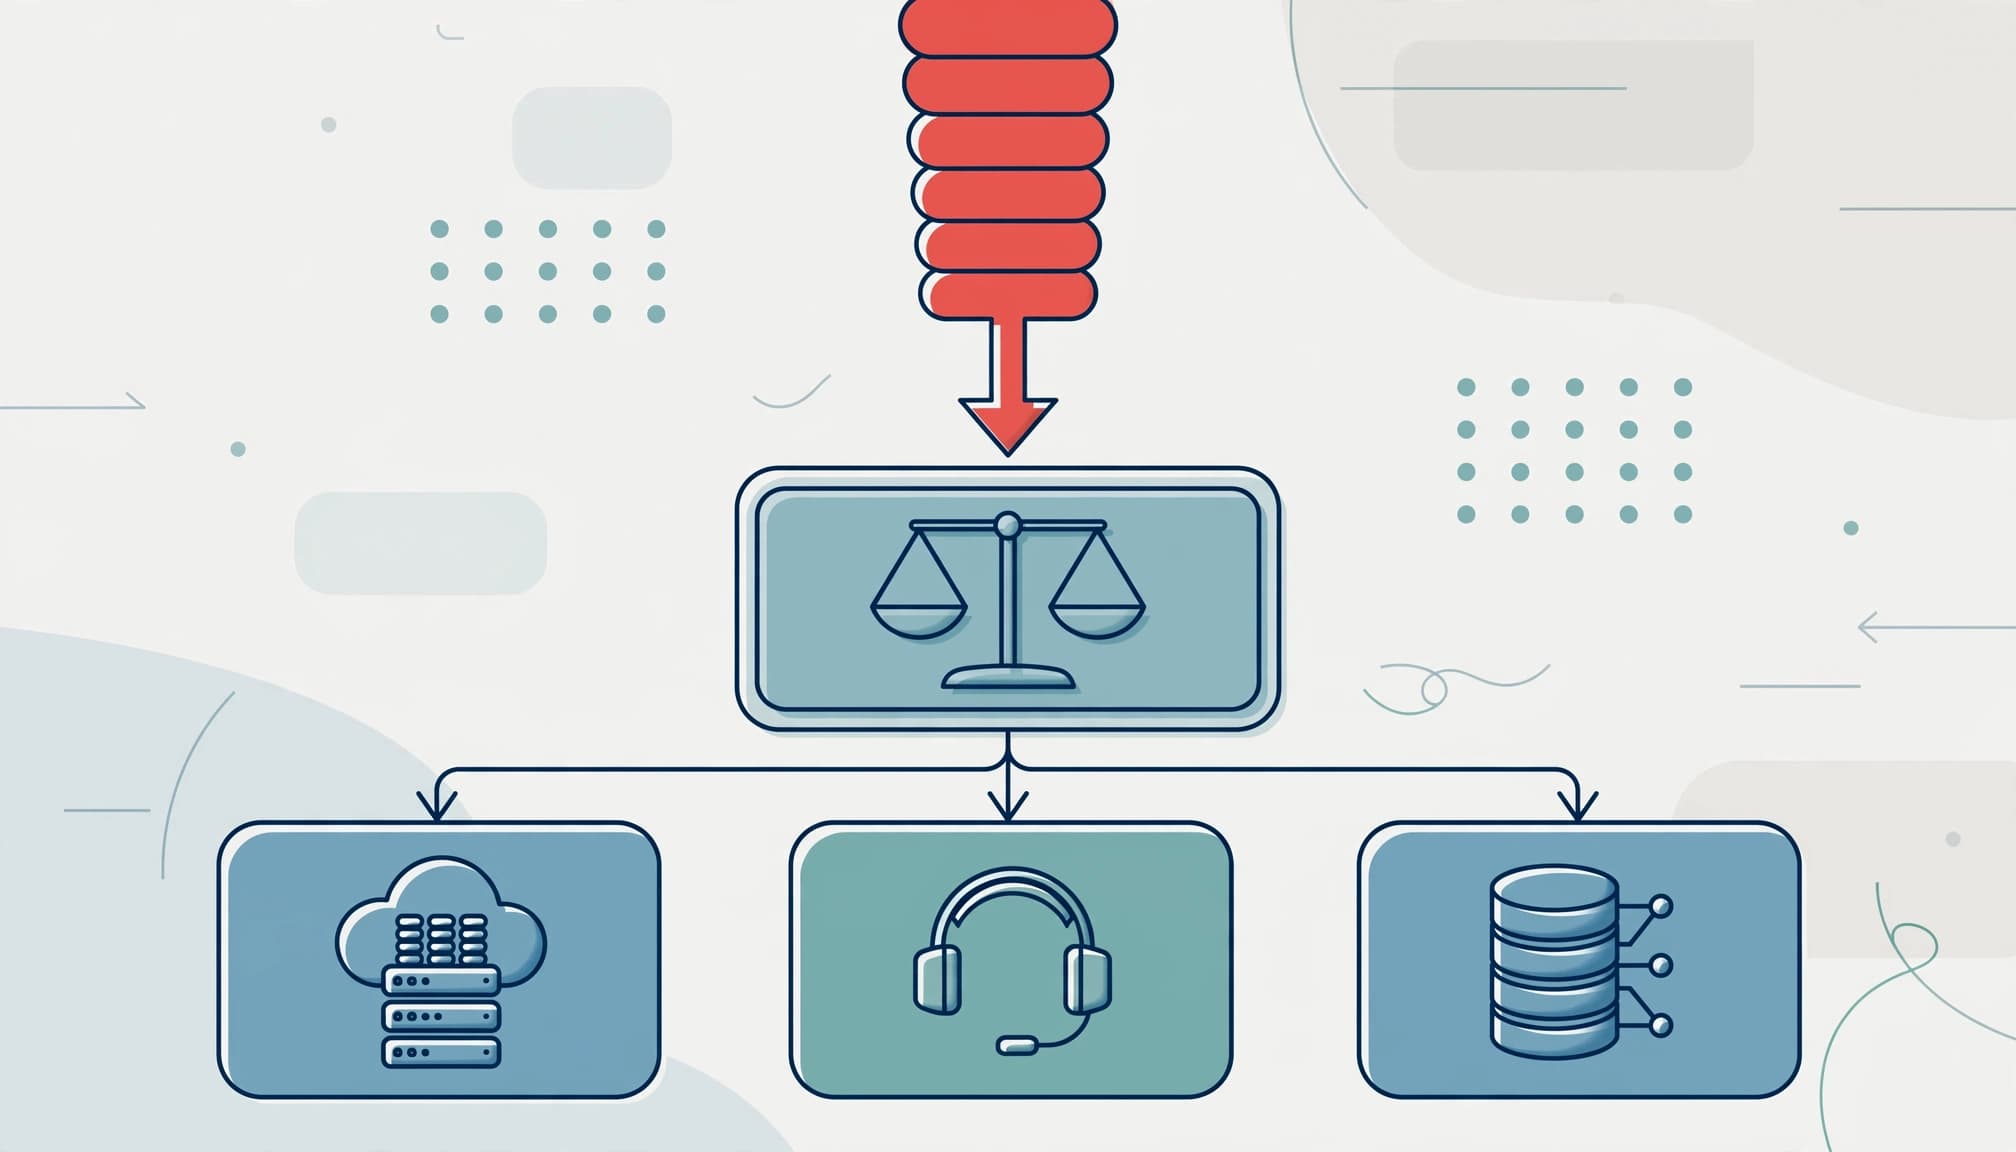
Your infrastructure bill needs a clear structure for assigning cloud costs to products, customer segments, revenue, and COGS. Finance, product, and engineering should be able to explain the same numbers.
Give direct and shared costs defensible owners
Assign dedicated resources directly to a product or customer segment. Group shared compute, databases, storage, and data transfer into cost pools with documented allocation rules.
Choose consumption measures that explain the cost. Requests, storage volume, and compute usage can be more useful than headcount when allocating shared costs.
AWS’s cloud financial management guidance distinguishes allocation of shared resources, standalone resources, and commitment purchases.
Your method doesn’t need six decimal places. It needs reliable data, an accountable owner, and documented rules leadership can understand. Our approach to technology cost allocation applies that discipline across shared spending.
Measure cost against a useful business unit
Track cloud cost per active customer, tenant, or transaction. Choose the unit that reflects how your product delivers value.
Pair that measure with revenue and customer-segment gross margin to assess unit economics. A large customer may generate attractive revenue while consuming disproportionate customer support, storage, or processing capacity.
For AI-enabled products, include model usage, supporting infrastructure, and delivery-related human review. Cheap model calls don’t guarantee profitable customer outcomes.
A rising bill can support healthy growth when unit costs fall and gross profit increases. Lower total spending can also hide declining demand.
Read SaaS gross margin benchmarks in context
Benchmarks help you identify questions. They don’t set a universal target or determine whether your delivery model is healthy.
Published findings describe different populations.
| Source | Reported finding | What it helps you assess |
|---|---|---|
| Lighter Capital | 72% weighted average across 150-plus SaaS startups | Startup portfolio economics |
| OpenView | Seven in ten companies above 70%; strongest performers at least 80% | Distribution rather than one average |
| Software Equity Group | 56% above 70%; 17% above 80% | How companies fall across margin bands |
Lighter Capital’s margin benchmark is weighted. Larger companies therefore influence the result differently than they would in a simple company average.
Other differences include company stage, services mix, and whether customer support sits in COGS. Compare definitions before comparing percentages.
An early-stage business can use 50% as a minimum planning target, with improvement expected as it scales. That isn’t a comfortable destination for an established subscription business.
Use benchmarks to assess scalability, then compare your own gross margin by segment. Is subscription margin improving? Which segments dilute it? Does additional revenue require proportionate delivery spending?
Those answers reveal more than a single industry average.
Improve Margin Without Weakening the Business
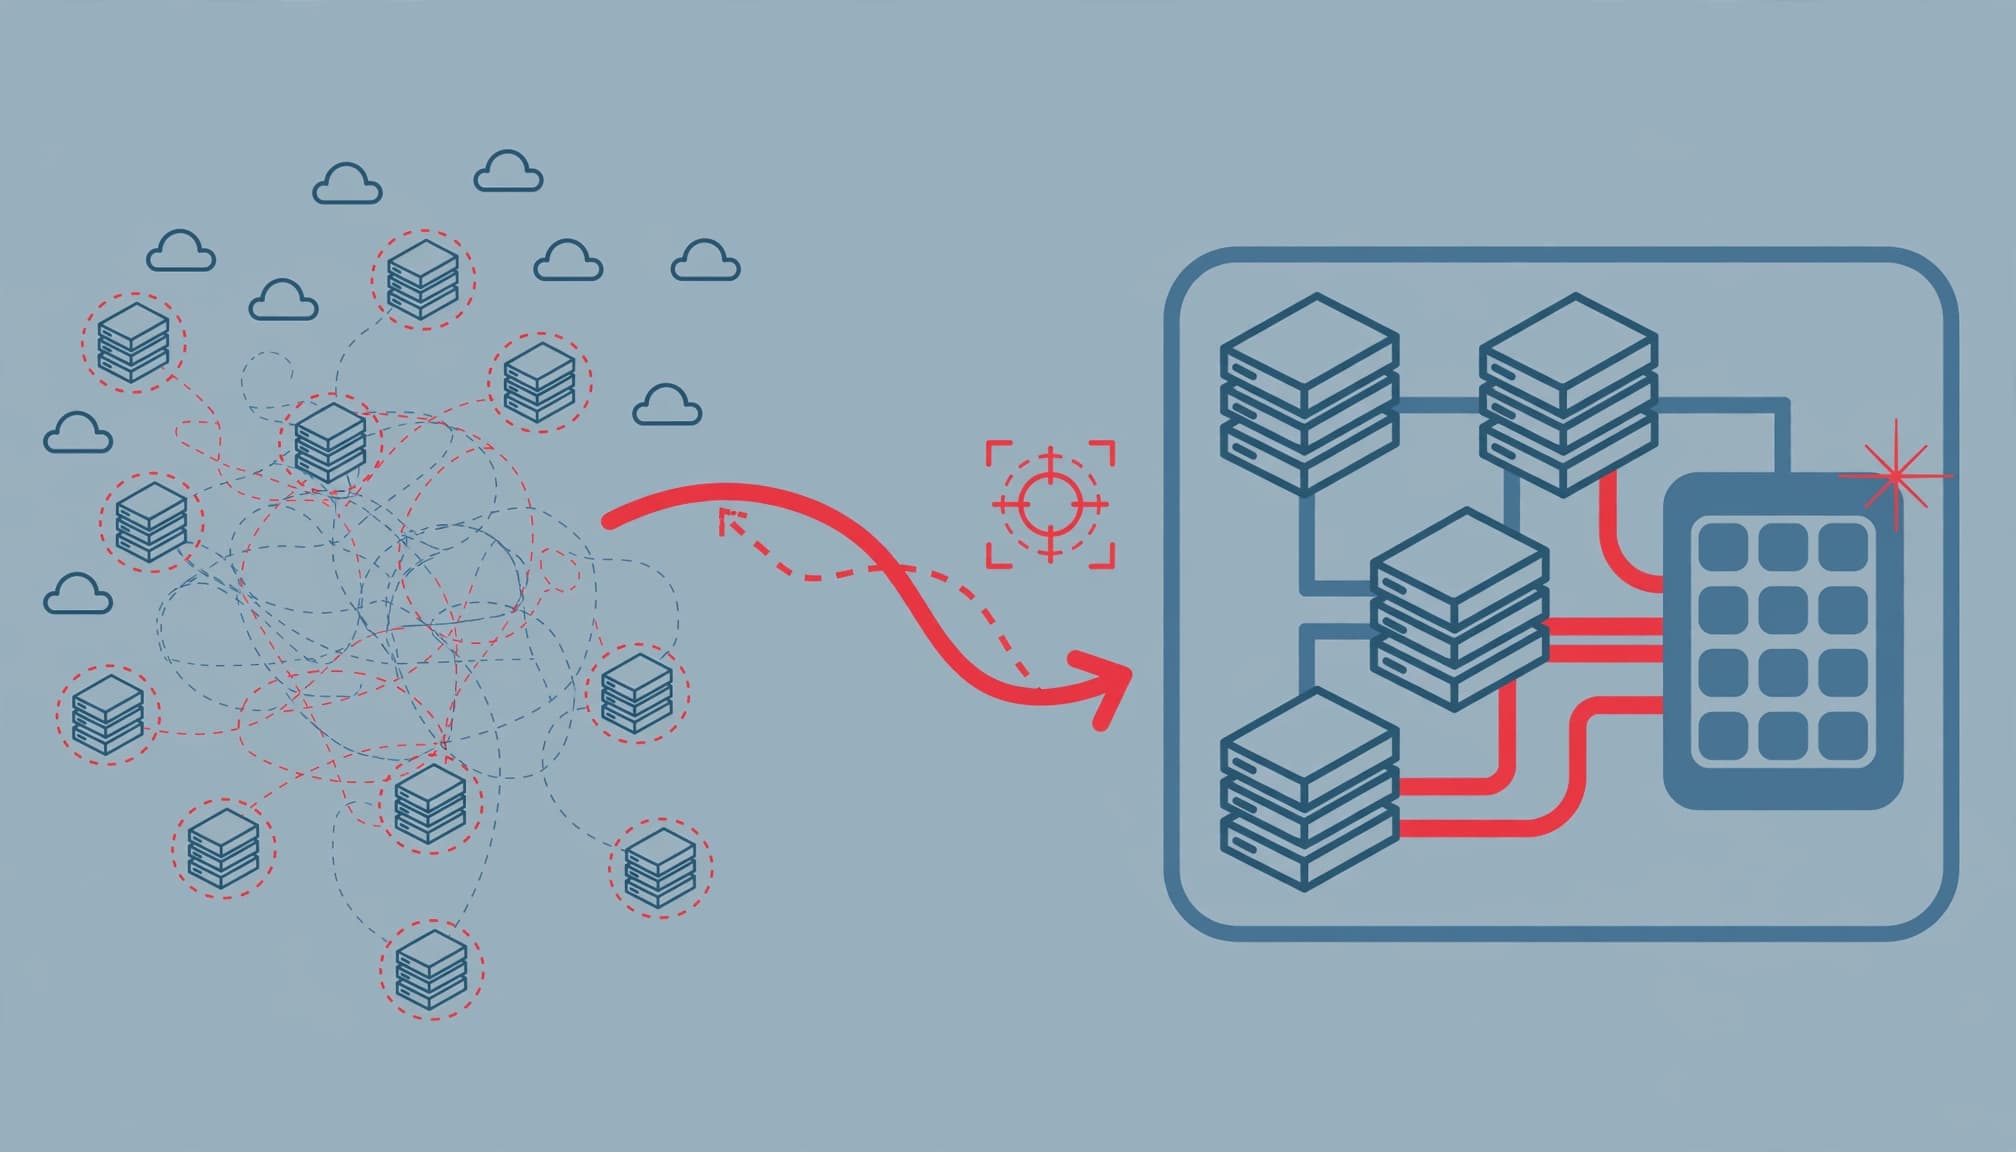
Technology spend optimization should protect profitable growth. Savings that cause outages, slower releases, or customer churn reduce the net benefit.
Remove waste before accepting bigger commitments
Start with idle environments, oversized databases, unnecessary data movement, and storage without a retention purpose. Address expensive workloads before negotiating discounts across everything.
AWS’s cost optimization framework connects resource decisions with financial outcomes.
Approve reserved capacity or other commitments only against predictable demand. A discounted resource you don’t need still consumes cash.
For each proposed change, record the owner, expected reduction, implementation cost, service constraints, and stop conditions. Our guidance on controlling cloud costs connects those actions to business priorities.
Show how savings change margin
At $500,000 of revenue, a net $5,000 reduction in delivery costs recorded in COGS adds $5,000 to gross profit. With revenue unchanged, that raises gross margin by one percentage point.
Count the net reduction after migration costs, replacement services, and added support. Service problems that drive customer churn can also reduce the savings.
Reclassifying $5,000 outside cost of revenue can produce the same reported margin increase without reducing total company expense.
Explain margin changes through their actual causes: revenue mix, pricing, consumption, supplier rates, efficiency, or accounting changes.
If you reinvest cloud savings, distinguish the gross benefit from the net company impact. Security improvements, integration work, or targeted AI investment may be sensible uses. They still require a clear business case.
Give the Board a Clear Cost and Margin Story
Board reporting should connect the financial result with the decisions behind it.
Review allocation methods and unit-cost drivers monthly with Finance, Product, and Engineering. Bring material trends, realized savings, commitments, and decisions to the board quarterly.
Report subscription and blended margin, infrastructure spend versus forecast, cost per customer or transaction, segment profitability, and customer churn. Costs recorded in R&D or outside COGS affect reported SaaS gross margin differently from costs classified in COGS.
In the SaaS P&L, show professional services and customer success costs consistently, with their COGS or operating expenses treatment clear.
Name one executive owner for the complete picture. Finance owns accounting integrity. Engineering owns resource and architecture decisions. Product owns demand assumptions. One person must reconcile those views and explain the tradeoffs.
When you have a technology leadership gap, a fractional CTO or interim CTO can establish that ownership and operating discipline.
Put larger changes into a 12-month IT roadmap. Technical debt management, pricing changes, and architecture work need sequencing, rather than competing as disconnected projects.
Your technology strategy should make the tradeoff visible: what you will spend, what outcome should change, and what evidence will justify continuing.
That creates reporting leaders can trust without turning the board discussion into a review of infrastructure line items.
Frequently Asked Questions
Does gross margin determine SaaS valuation?
SaaS gross margin gives investors insight into delivery efficiency and scalability. Higher delivery efficiency leaves more revenue available for growth and profit.
But it doesn’t determine valuation alone. Growth, retention, market position, and profitability also matter. Improving margin through deferred maintenance can weaken the business investors are evaluating.
A stronger case connects margin improvement to durable operating changes and consistent accounting.
Is SaaS gross margin the profit margin in the Rule of 40?
No. The Rule of 40 combines revenue growth with a profit measure, commonly EBITDA margin or free cash flow margin. It targets a combined result above 40%.
This measure sits earlier in your P&L. It excludes operating expenses that still affect profitability.
You can have strong delivery economics and weak overall profitability. Track both, since weak delivery economics or customer churn can hurt the broader performance picture.
Make Infrastructure Spending a Decision You Can Explain
Your next leadership conversation should connect delivery costs, customer economics, and accountable decisions. Consistent definitions make that conversation credible.
Start with a reconciled margin view and one owner for the actions it reveals. If the spending story remains unclear, Get an Executive Technology Clarity Check.
You should be able to explain what infrastructure costs, what it supports, and which decision will improve the business.