

AI activity is easy to report. Real productivity gains are harder to prove. If you’re a CEO, COO, CFO, founder, or board member, you need more than tool adoption, prompt counts, or a list of new licenses. You need to evaluate generative ai tools based on their true productivity impact across teams, including whether AI is improving revenue, margin, capacity, quality, risk, or cash.
The right question is how to measure ai productivity gains without confusing motion with value. That starts with understanding artificial intelligence productivity in business terms, where every metric answers a business question and supports a decision. AI measurement belongs inside a business-aligned technology strategy, supported by technology leadership for growing companies, not in a separate innovation report.
Key Takeaways for Measuring AI Productivity Gains
- Establish a trusted baseline performance model before rollout.
- Measure time savings, value created, quality, and risk together.
- Separate gross productivity from realized business impact.
- Report trends, owners, targets, and thresholds.
- Give leadership actionable developer productivity metrics and evidence of outcomes, rather than a catalog of AI tools.
A board doesn’t need to know how many prompts employees submitted. It needs to know what improved, what it cost, what risk changed, and who owns the next decision. That’s the foundation of how to measure AI productivity gains in a way leadership can trust.
Download the AI metrics one-pager as a practical starting point for your next leadership review.
How to Measure AI Productivity Gains Without Counting the Wrong Things
AI activity is not productivity. Productivity is not business value.
A team may use an AI assistant every day without completing more valuable work. Developers using coding assistants across the software development lifecycle may increase code volume while creating more defects, slowing reviews, or increasing cognitive load. A customer service team may reduce handling time while increasing repeat contacts.
Simple utilization metrics and usage frequency can create a flattering picture. So can license counts, generated lines of code, and employee estimates of hours saved. None proves that the business is better off. For engineering teams, stronger evidence includes pull request throughput, reduced code review time, defect rates, and delivery outcomes.
A stronger model has six parts:
- Establish the baseline before AI changes the process.
- Measure the change in time, output, or capacity.
- Check quality and customer outcomes.
- Track adoption across the intended workflow.
- Calculate realized value, not forecast value.
- Assign a cost to risk, oversight, and rework.
Consider customer service. If AI reduces average handling time from 10 minutes to eight, that’s a useful signal. It isn’t the full result. You also need resolution quality, repeat contacts, escalation rates, customer satisfaction, staffing levels, and backlog. If agents save two minutes but spend those minutes fixing inaccurate responses, the gain is smaller than it first appears.
Your technology strategy and alignment between technology and business goals should define which outcomes matter. That makes AI measurement part of normal investment discipline, including measuring technology spending ROI.
### Start with a baseline your finance team can trust
Before deployment, capture baseline performance across engineering workflows, including cycle time, labor cost, output volume, error rates, rework, service levels, customer outcomes, and employee effort. A clear baseline also helps teams identify where AI can reduce cognitive load and improve the overall developer experience.
Use a control group, a historical comparison, or a before-and-after sample when possible. The comparison doesn’t need to be perfect. It does need to be honest, particularly when evaluating coding assistants across the software development lifecycle.
Document four things:
- The process owner.
- The data source.
- The measurement period.
- Known limitations in the data.
A baseline without an owner becomes a spreadsheet exercise. A baseline with clear ownership gives finance, operations, and technology a shared starting point. It also makes changes in pull request throughput, code review time, and developer experience easier to interpret against baseline performance.
Separate time saved from value actually realized
Saved minutes don’t automatically become hard-dollar savings. The capacity must be used for more output, faster service, lower overtime, avoided hiring, or lower operating cost. Measure realized time savings through business outcomes, not superficial productivity numbers.
You can calculate gross time saved like this:
Gross time saved = baseline time per task minus current time per task, multiplied by completed tasks
Then subtract the full cost of the change, including AI licenses, integration, data preparation, training, review, security, and change management. For engineering teams, that review may include code review time, quality checks, and the effect of AI on pull request throughput.
Realized value may show up as:
- More customers served without adding staff.
- Faster delivery of revenue-producing work.
- Higher pull request throughput without increased defects.
- Lower overtime or contractor spend.
- Fewer errors and less rework.
- Delayed hiring that the operating plan can support.
Don’t treat every reported hour as a financial saving. Treat it as released capacity until the business shows where that capacity went and confirms the resulting time savings.
The AI Productivity Metrics That Survive a Board Question
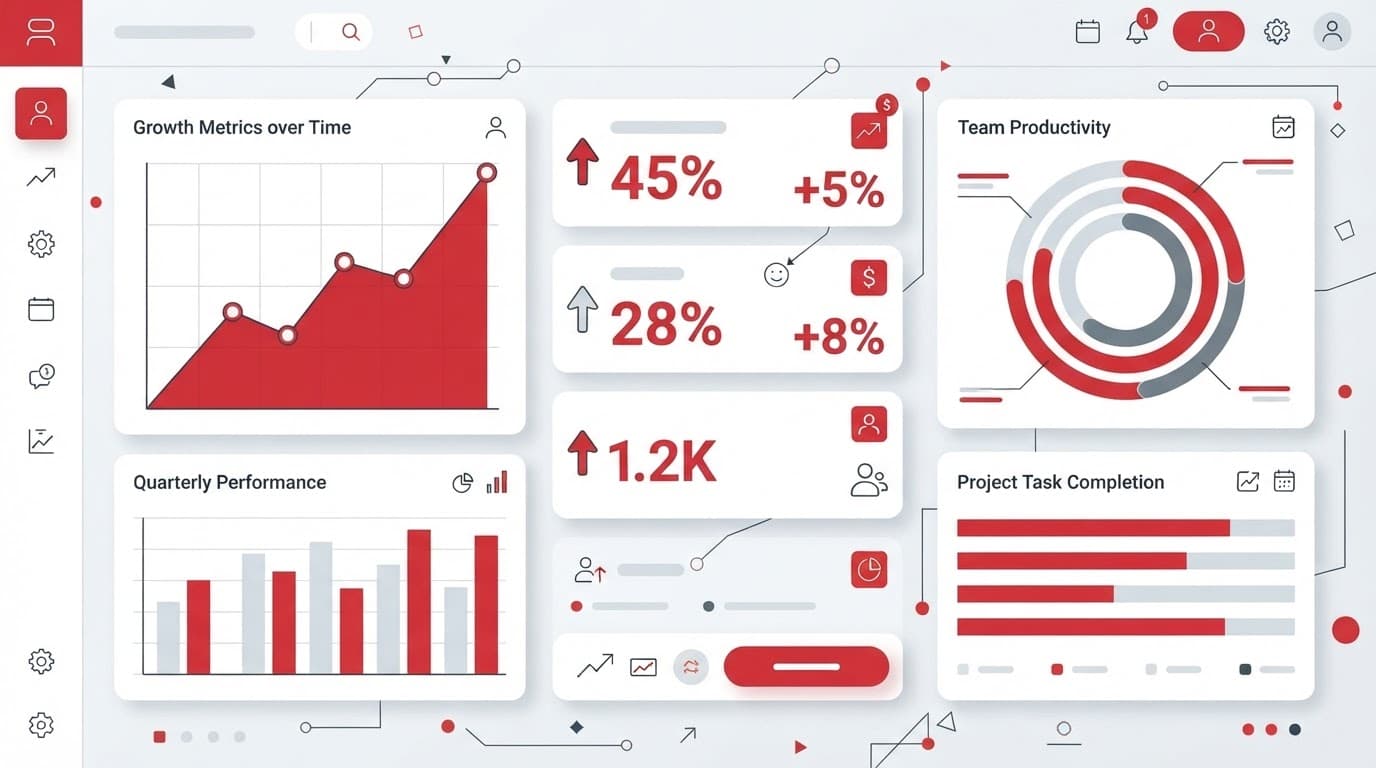
A board-ready dashboard should be short. Show trends, targets, owners, and exceptions, including deployment velocity, operational efficiency, and change failure rate where they affect business outcomes. Keep technical detail in an appendix.
| Metric area | What to measure | Data needed | Board question |
|---|---|---|---|
| Financial | Revenue, margin, cost per transaction, payback, and other cost metrics | Finance data and full AI cost | What value has been realized? |
| Operations | Cycle time, throughput, backlog, capacity, and deployment velocity | Workflow, staffing, and delivery data | What work can the business handle now? |
| Quality | Error rate, rework, escalations, satisfaction, and change failure rate | QA samples, code quality metrics, and customer data | Did speed create new defects? |
| Risk | Incidents, exceptions, exposure, vendor dependency | Security, legal, and audit data | What could materially hurt the business? |
Financial impact: revenue, margin, and cost to serve
Track incremental revenue, gross margin impact, cost per transaction, labor cost avoided, cash impact, payback period, and return on investment.
Separate forecast value from realized value. A business case may predict $500,000 in annual savings. The board should see how much has actually appeared in the income statement, staffing plan, service capacity, or cash position.
Include all costs. That means licenses, implementation, integration, data cleanup, training, human review, security controls, vendor management, and change work.
If your organization needs stronger executive judgment around technology spend, CTO Input’s services provide a broader oversight model than a tool-by-tool review, helping leaders connect investment decisions to a clear return on investment.
Operational impact: cycle time, throughput, and capacity
Measure time to complete work, throughput per employee, backlog, wait time, first-response time, capacity released, and deployment velocity. These measures show whether AI is improving operational efficiency rather than simply accelerating one task.
Measure the whole workflow, not only the AI-assisted task. Evaluate complex agentic workflows alongside standard development tasks, because faster drafting may create a review bottleneck, while faster intake may overwhelm fulfillment. Faster code generation may also increase testing and approval work.
A useful board question is simple: What can the business do now that it could not do before, without adding the same level of cost?
Quality and customer outcomes: accuracy, rework, and trust
Track error rate, rework, escalation rate, first-pass acceptance, customer satisfaction, retention, and complaint volume. For software teams, pair these outcomes with code quality metrics and change failure rate to show whether delivery speed is affecting software quality.
Productivity gains aren’t real if AI shifts work to reviewers or increases customer friction. Use quality sampling and automated testing during review cycles, especially for work involving pricing, legal commitments, employment decisions, financial reporting, or customer safety. Code quality metrics should reveal whether faster delivery is creating more defects, while software quality remains stable.
Human review should remain part of the process when an inaccurate output could create material harm. Speed is not a substitute for sound judgment, and a rising change failure rate can signal that controls aren’t keeping pace with delivery.
Risk and control: incidents, exceptions, and exposure
AI can create privacy incidents, security events, policy violations, unsupported claims, intellectual property concerns, model drift, and vendor dependency.
Report each material risk in business terms. Name the likelihood, impact, owner, threshold, and mitigation. A board shouldn’t receive a technical risk score with no explanation of what happens next.
Use a clear technology risk oversight process. Connect AI decisions to cyber risk appetite and third-party risk reporting.
Build an AI Productivity Scorecard Leaders Can Act On
Start with three to five business outcomes. Each AI initiative should connect to growth, margin, customer experience, resilience, compliance, risk reduction, or more efficient software delivery. Include actionable developer productivity metrics where they help explain how engineering work contributes to those outcomes.
Set a baseline and target. Name the data source, including any source control, workflow, or delivery systems used to measure pull request throughput, code review time, and verified time savings. Assign a business sponsor and a technology owner. Review results monthly, then provide a concise update to the board each quarter.
A one-page technology strategy can keep the scorecard tied to priorities. A practical technology roadmap can show dependencies, timing, and tradeoffs. The broader business-aligned technology strategy should explain why the work matters.

### Give every metric an owner, decision rule, and next action
A dashboard without ownership becomes background noise.
Each metric should identify who validates the result, who can change scope or funding, what threshold triggers action, and when leadership reviews it. For engineering initiatives, that may include pull request throughput, code review time, developer experience, and code maintainability, not just activity volume.
For example, you might stop a pilot when quality falls below an agreed level or code review time fails to improve. You might expand it when realized value and time savings reach the target. You might redesign the workflow when adoption remains low despite adequate training, or when developer experience declines even as pull request throughput rises.
The issue may not be employee resistance. It may be a poor process, unclear incentives, or a tool that doesn’t fit the work. Review the underlying developer productivity metrics before deciding whether the initiative is improving software delivery.
Report AI progress in the language your board uses
A board-ready update can fit on one page. Include:
- The business outcome.
- The baseline and current result.
- The financial effect, including verified time savings.
- The material risk.
- The decision required.
- The accountable executive.
- The next milestone.
Keep architecture diagrams and model details in an appendix. The same discipline used in board technology reporting and fractional CTO board meeting preparation applies here.
For cyber-related reporting, use the principles behind what to report to the board about cyber and a board-ready cybersecurity reporting template. The board needs clear exposure, ownership, timing, and consequence. The same clarity helps leaders assess whether AI is improving software delivery and developer experience, rather than simply increasing reported activity.
Avoid AI Measurement Traps That Make Productivity Look Better Than It Is
The most common mistake is measuring adoption instead of outcomes. A high adoption rate may show that employees opened a tool. It doesn’t show the true productivity impact, whether the business gained capacity, or whether results improved.
Other problems appear quickly:
- Treating every saved hour as a hard-dollar saving.
- Ignoring review time, rework, and downstream bottlenecks.
- Comparing teams with different work mixes.
- Changing the baseline after launch.
- Overlooking shadow AI, including unmonitored generative AI tools and coding assistants that can introduce hidden technical debt.
- Rewarding speed when judgment and quality matter more.
- Counting forecast value as realized value.
- Relying on vendor utilization metrics instead of measuring outcomes across the entire software development lifecycle.
Tool sprawl creates another problem. Overlapping AI products increase license costs, data exposure, training demands, and vendor dependence. Ungoverned adoption of generative AI tools across software teams can also degrade code health, create technical debt, and add risk throughout the software development lifecycle. Tool sprawl is a governance problem, not only a procurement issue.
Vendors can also push your organization toward features that serve their roadmap instead of your business priorities. Use vendor control over the technology roadmap as a governance question. Ask what decision rights remain with your leadership team.
If no one owns the measurement model, the problem may be a technology leadership gap. You can Talk Through Your Technology Leadership Gap before approving another tool. CTO Input can provide fractional CTO services when you need continuing executive judgment, or interim CTO leadership when a leadership seat is open or the business needs immediate control.
The same evidence standard matters during acquisitions and major transitions. Technical due diligence tests whether reported capability matches operational reality. If the company is preparing for scrutiny, use Prepare Technology for Diligence or Transition to organize systems, risks, vendors, ownership, and reporting.
You can also review a when to hire a fractional CTO guide if the business has outgrown informal technology leadership. The right question isn’t whether you have enough AI activity. It’s whether someone owns the business result.
Frequently Asked Questions
What is the best way to measure AI productivity gains?
Start with a trusted baseline for time, output, quality, cost, and risk before AI changes the workflow. Then compare the current results with that baseline and connect any improvement to a measurable business outcome.
Which AI productivity metrics matter most to the board?
Boards typically need financial impact, operational capacity, quality, customer outcomes, and risk exposure. Metrics such as realized savings, revenue or margin impact, cycle time, throughput, error rates, customer satisfaction, and material incidents provide a more complete view than usage or license counts.
Are reported hours saved the same as financial savings?
No. Reported hours represent gross capacity unless the business converts that time into more output, faster service, avoided hiring, lower overtime, or reduced operating cost. Subtract AI licenses, integration, training, oversight, rework, and other implementation costs before calculating realized value.
How can leaders avoid overstating AI productivity gains?
Use a consistent baseline, measure the entire workflow, and track quality, rework, downstream bottlenecks, and risk alongside speed. Separate forecast value from realized value, and give every metric an owner, target, threshold, and next action.
How often should AI productivity results be reported?
Review the scorecard monthly so owners can address exceptions and workflow problems quickly. Provide the board with a concise quarterly update covering outcomes, financial impact, material risks, accountability, and the decision required.
Conclusion
Understanding how to measure AI productivity gains requires connecting AI activity to measurable business outcomes, including its real productivity impact on software delivery rather than relying on surface-level activity. The strongest metrics show the full cost, include quality and risk, distinguish forecast value from realized value, and name an accountable owner.
With clear executive governance, artificial intelligence productivity becomes measurable business value instead of a speculative initiative. Start with one important workflow, a baseline your finance team trusts, and a small scorecard. If AI decisions feel scattered, risky, or difficult to defend, Get an Executive Technology Clarity Check. Clear evidence gives leadership a better basis for confident decisions.